Benchmarks
The Tangle project has the ability to generate test projects and run synthetic benchmarks against it, using Gradle-Profiler.
For the time being, the intent of these benchmarks is to provide a hermetic comparison between Hilt and Tangle's build times, with as few variables as possible.
The generated test projects represent best-case scenarios, in that no library module depends upon
any other library module, and each library module only has a single empty Fragment and
empty ViewModel. The build speed percentage gain from using Tangle is most likely higher than
anything which could be observed in a real world application.
To run these tests yourself, check out the Tangle project and
run ./gradlew profile. The generated code is in $rootDir/build/benchmark-project.
The generated benchmark project is also hosted on GitHub here, with different branches for different project sizes.
The results
These tests were all run on a water-cooled 12-core 4.3GHz hackintosh with 32GB of ram. I chose that machine because it has excellent cooling. A MacBook Pro will start overheating and thermal throttling during prolonged benchmarking, skewing the results.
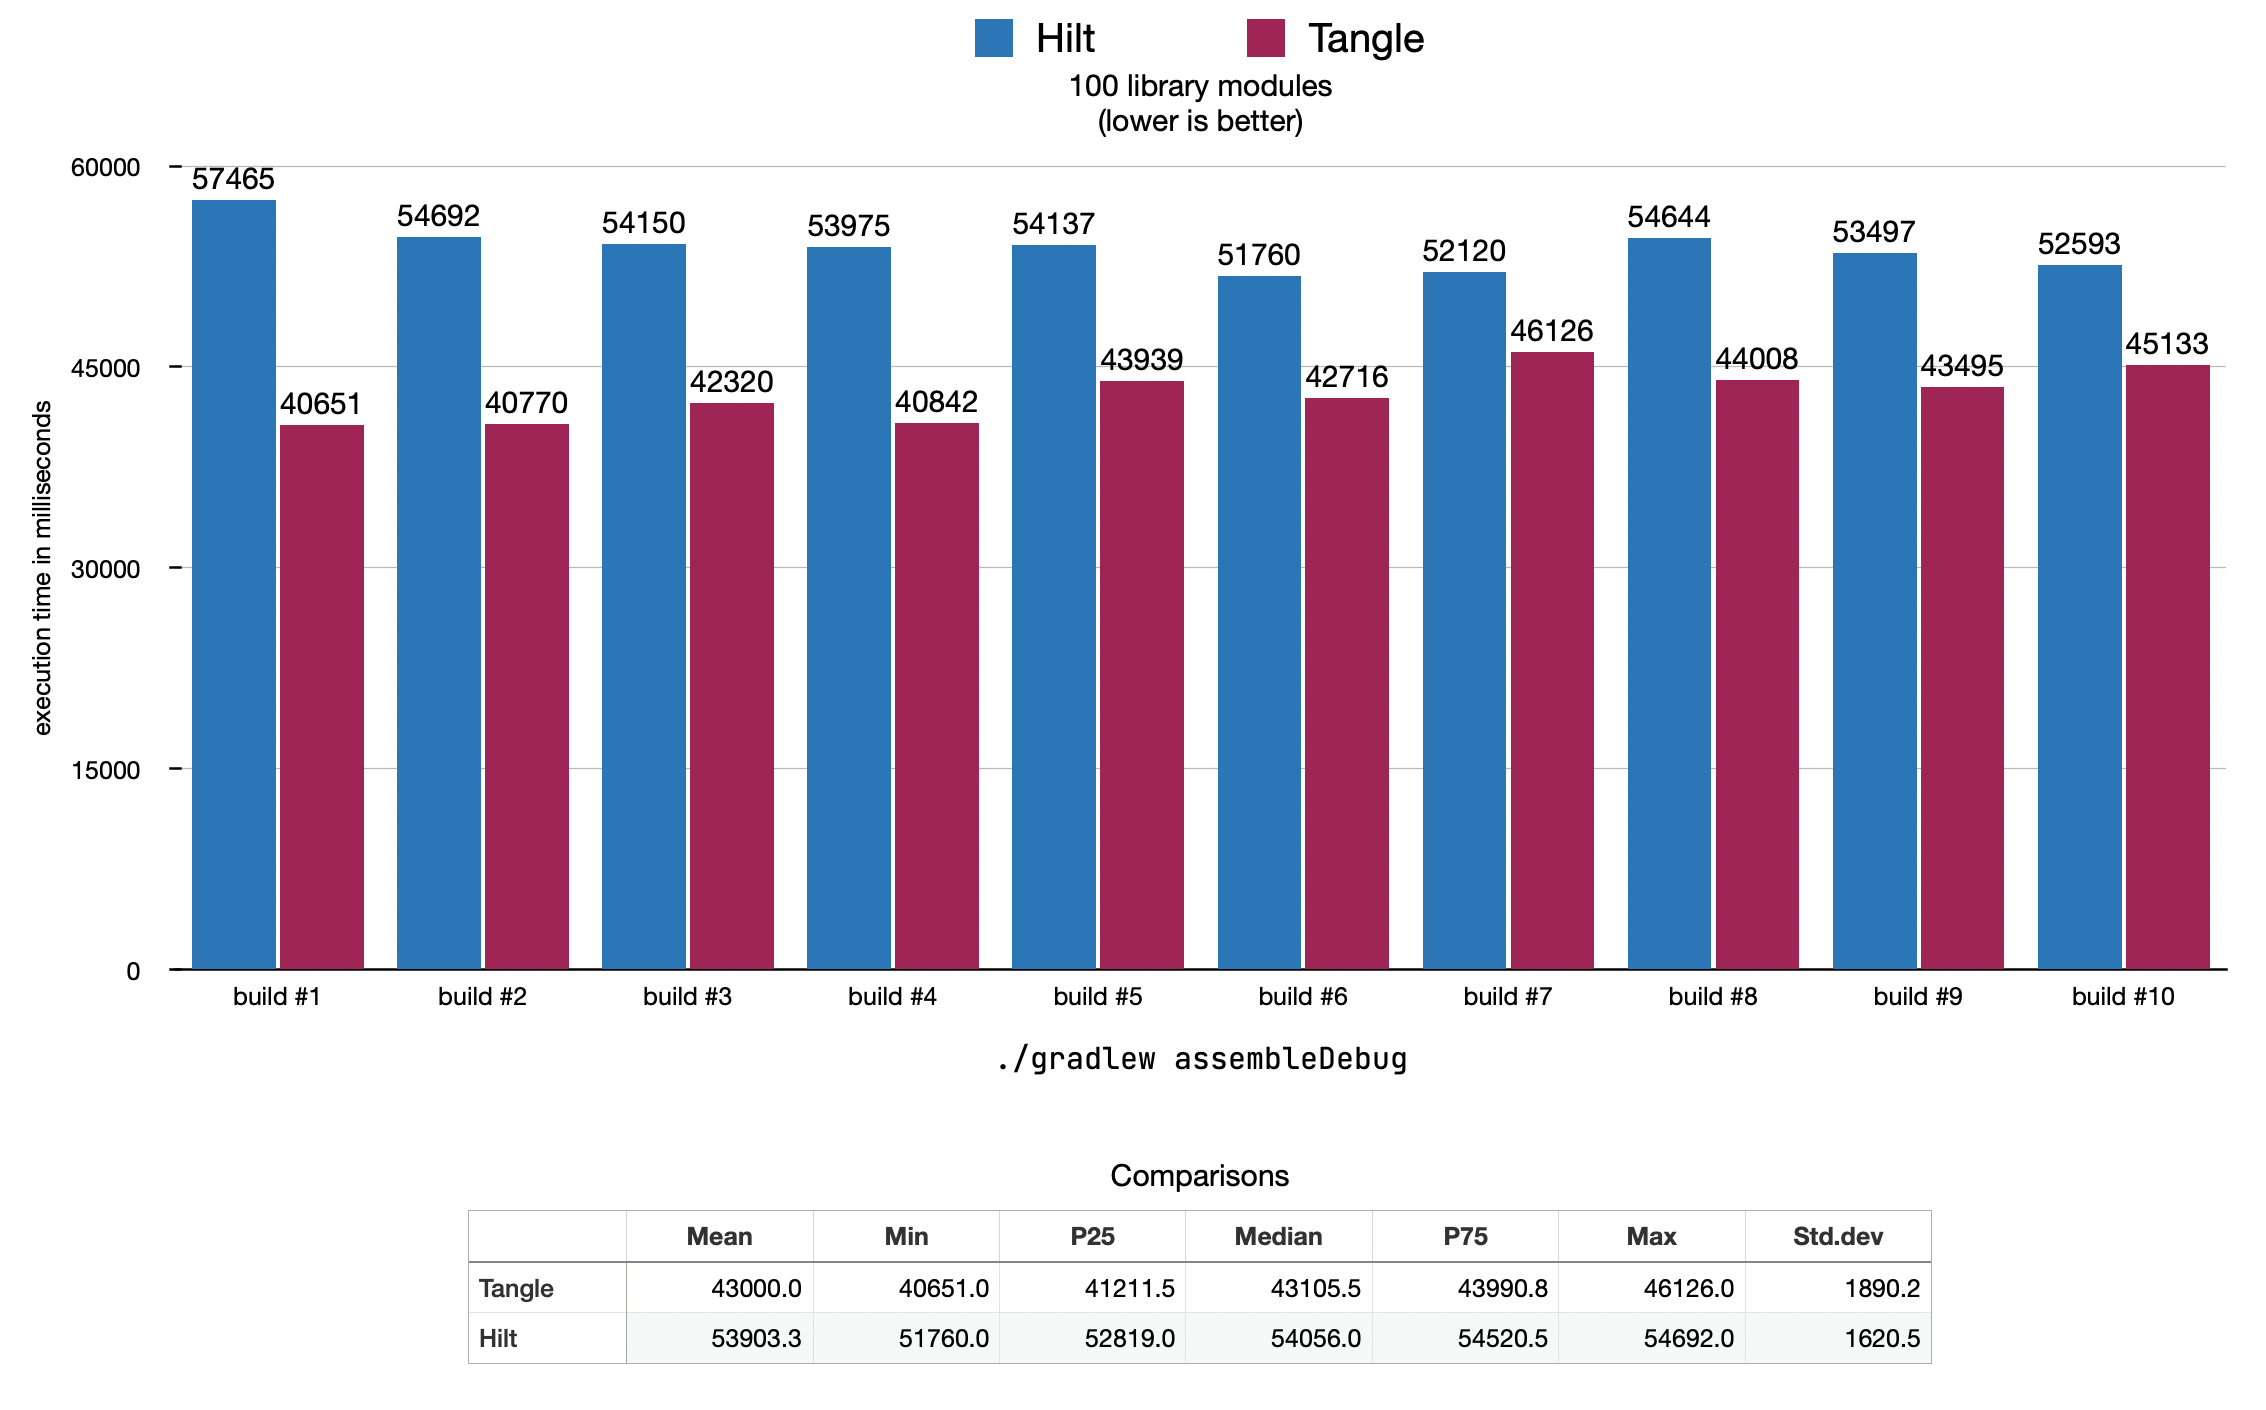
100 modules
Tangle's mean execution time was a 20.23% reduction from Hilt's mean.
full results from Gradle Profile here

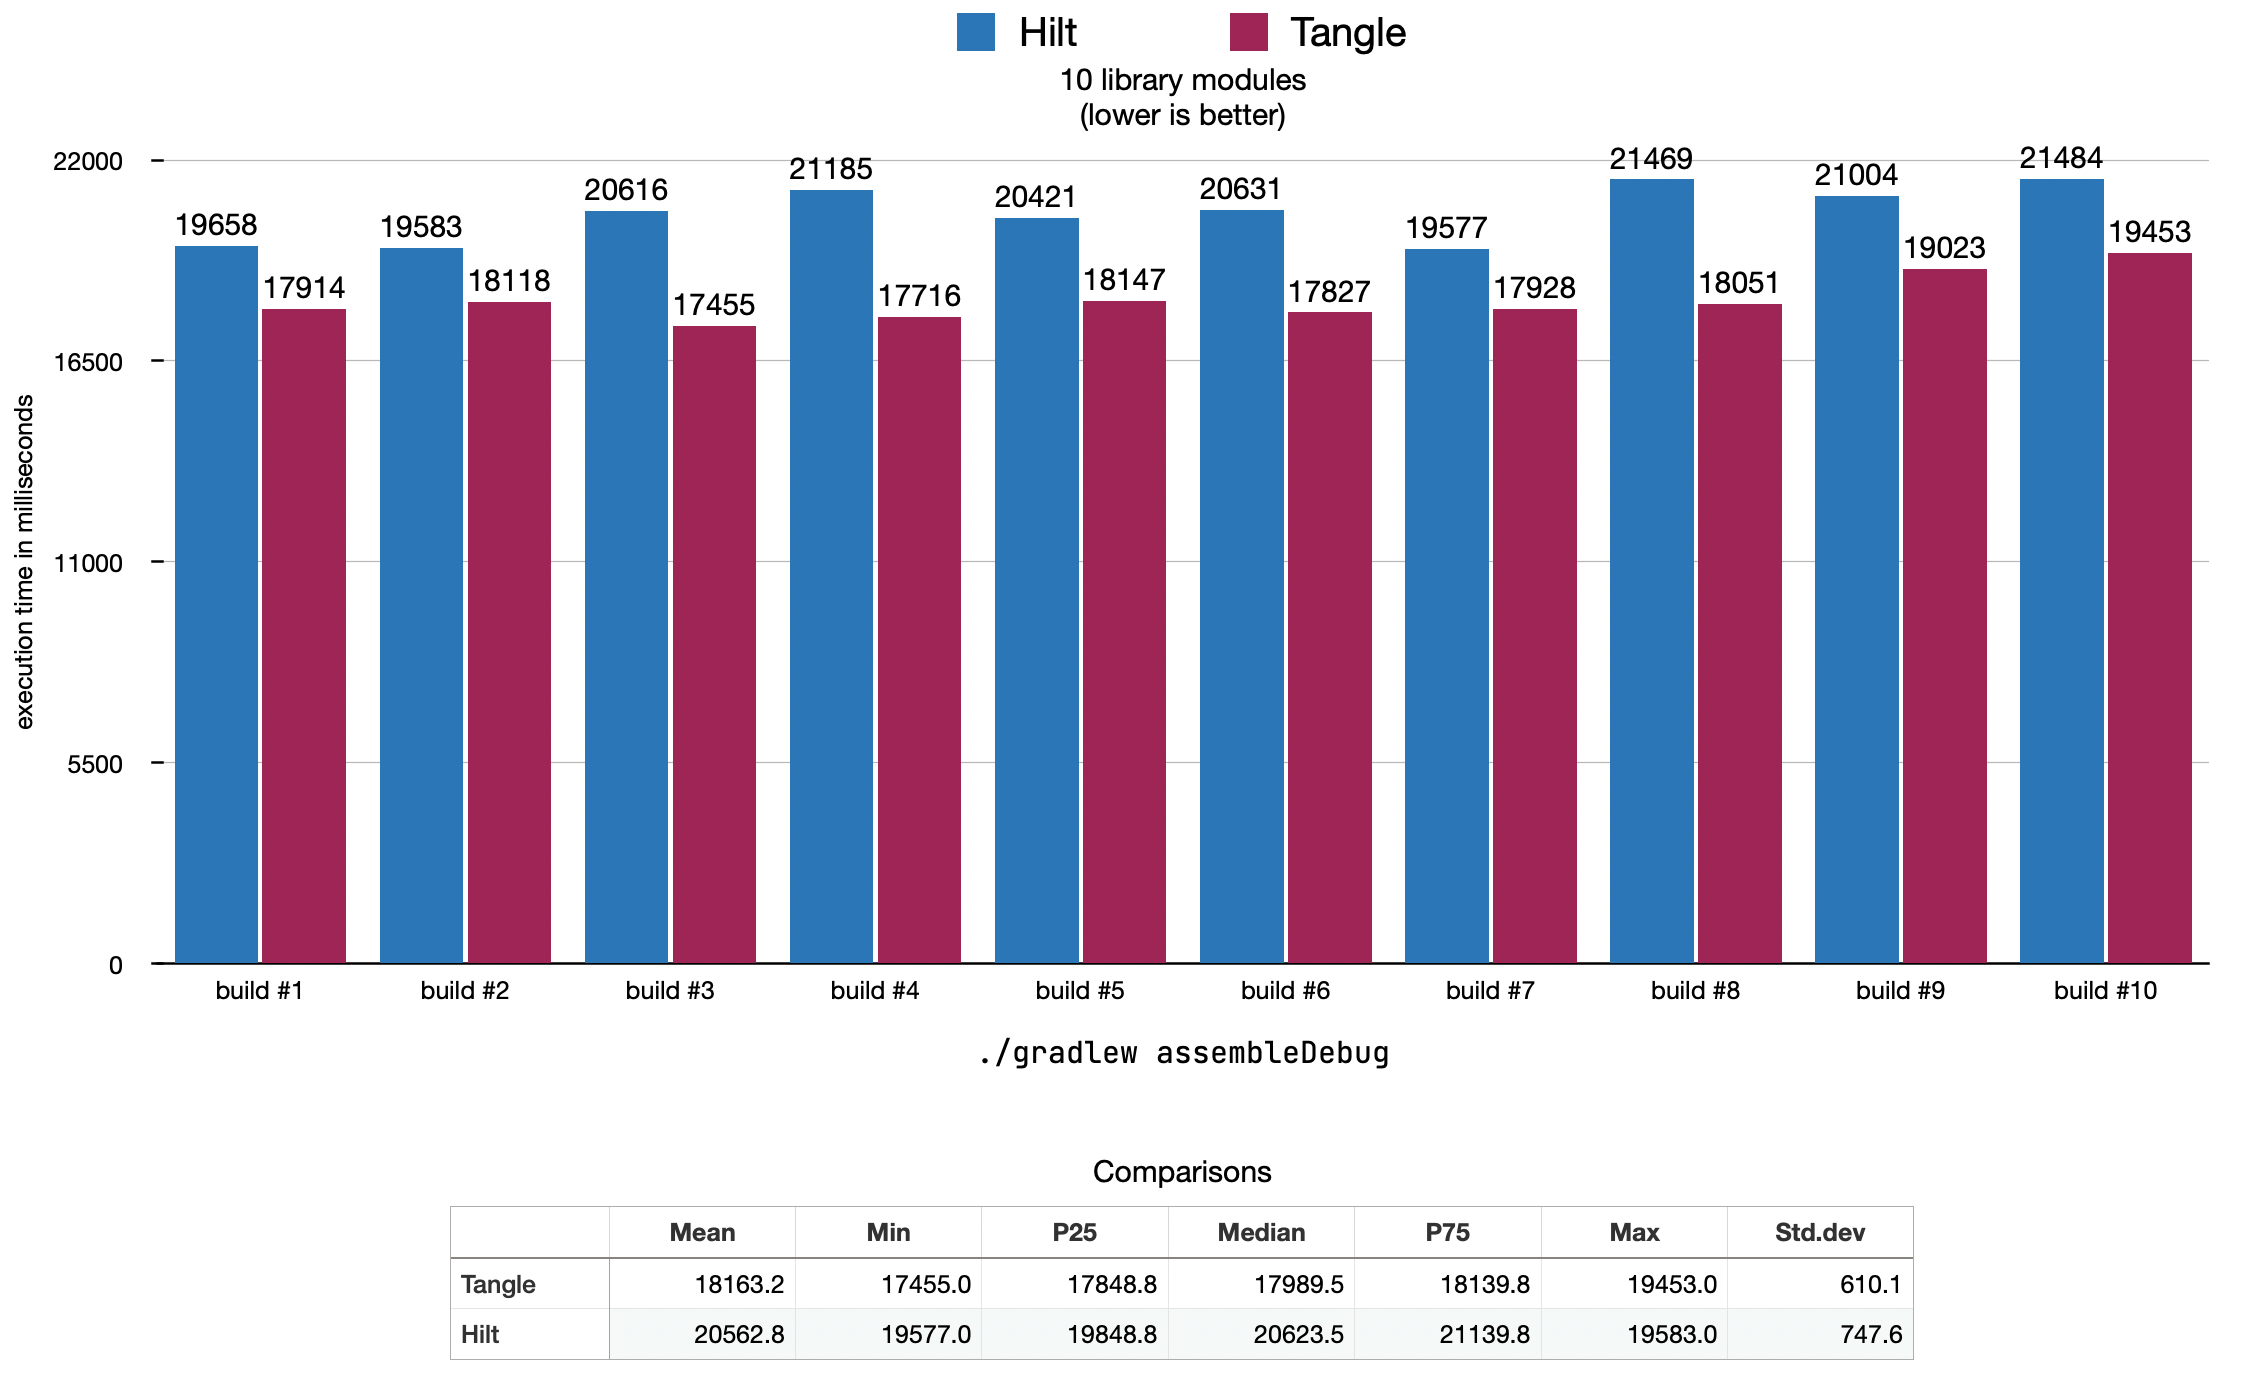
10 modules
Tangle's mean execution time was an 11.67% reduction from Hilt's mean. This is less significant because the Tangle test project still needs to generate a Component using Kapt/Dagger, and that cost is relatively static regardless of benchmark size. It's also comparable to the static cost of component generation in a Hilt project. In a real world project with a much more complicated Dagger graph, component generation should take longer.
It's also worth noting that an "11.67% reduction" in this case really just means that the build took 18 seconds instead of 20 seconds. For a project of this size, it's safe to say that the decision should be made based upon API surface rather than build performance.
full results from Gradle Profile here
